Solar Output Report
The reports were generated based on 100 kWp solar system as it is easier to calculate any other size based on the results.
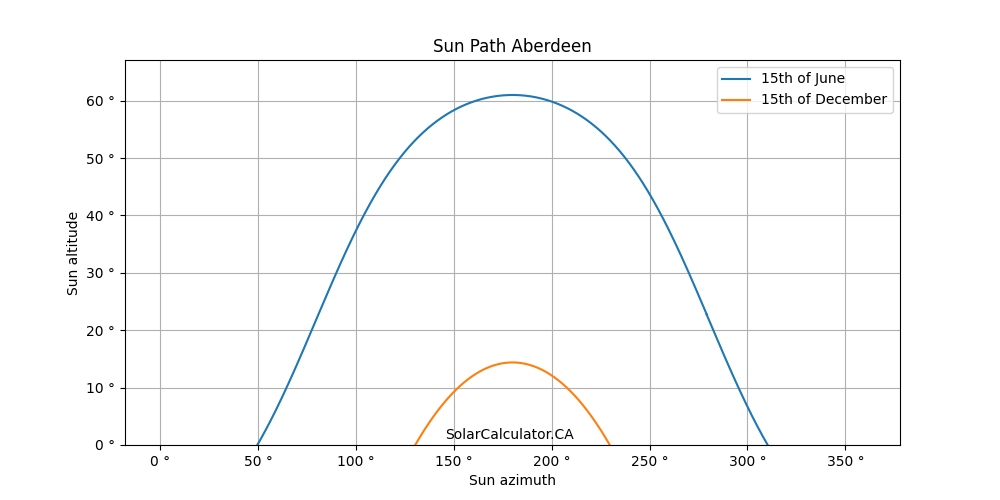
Location:- Location: Aberdeen
- GPS Coordinates: 52.325536, -106.291511
- Elevation: 516 m
- Total installed power: 100 kWp
- Solar panel technoloty: c-Si
- Installation: Fixed
- Optimal solar panel angle for Aberdeen: 44o
- Average yearly irradiance: 1473.71 kWh/m2
- Average yearly power output: 125445 kWh
Solar irradiance and output report at optimal angle - 44o
Solar irradiance
| Month | Average Daily kWh/m2/d | Average Monthly kWh/m2/mo |
|---|---|---|
| January | 1.68 | 52.06 |
| February | 2.52 | 70.57 |
| March | 3.52 | 108.97 |
| April | 5.22 | 156.57 |
| May | 5.93 | 183.97 |
| June | 5.49 | 164.63 |
| July | 6.28 | 194.57 |
| August | 5.74 | 177.96 |
| September | 4.84 | 145.07 |
| October | 3.47 | 107.72 |
| November | 2 | 60.09 |
| December | 1.66 | 51.52 |
| Total yearly | 1473.71 |
Solar power output
| Month | Average Daily kWh/d | Average Monthly kWh/mo |
|---|---|---|
| January | 161.24 | 4998.53 |
| February | 238.86 | 6688.05 |
| March | 317.44 | 9840.76 |
| April | 450.56 | 13516.7 |
| May | 495.26 | 15353.2 |
| June | 444.24 | 13327.3 |
| July | 502.61 | 15581 |
| August | 463.58 | 14371 |
| September | 401.28 | 12038.3 |
| October | 300.92 | 9328.53 |
| November | 182.29 | 5468.81 |
| December | 159.12 | 4932.63 |
| Total yearly | 125445 |
Solar power output reports at other common angles
As it is not always possible to install the solar panels at the optimum angle, we calculated some more options so you can get a better idea of the difference. A 3/12 roof pitch corresponds to about 14o slope so the result should be just a bit below the 15o output. 4/12 roof pitch(18.4o) fals between 15o and 20o. 5/12 pitch is 22.6o, 6/12 is 26.6o, 7/12 is 30.3o etc...
Aberdeen solar output calculated at 15o
| Month | Average Daily kWh/d | Average Monthly kWh/mo |
|---|---|---|
| January | 96.81 | 3001.23 |
| February | 166.68 | 4667.11 |
| March | 262.5 | 8137.39 |
| April | 424.79 | 12743.6 |
| May | 512.25 | 15879.9 |
| June | 481.16 | 14434.8 |
| July | 533.34 | 16533.6 |
| August | 454.26 | 14082 |
| September | 347.88 | 10436.5 |
| October | 225.87 | 7001.94 |
| November | 117.18 | 3515.33 |
| December | 89.2 | 2765.18 |
| Total yearly | 113198 |
Solar power generation calculated at 20o
| Month | Average Daily kWh/d | Average Monthly kWh/mo |
|---|---|---|
| January | 111.03 | 3441.86 |
| February | 183.59 | 5140.61 |
| March | 277.04 | 8588.21 |
| April | 435.13 | 13054 |
| May | 515.57 | 15982.6 |
| June | 479.95 | 14398.6 |
| July | 534.21 | 16560.4 |
| August | 461.92 | 14319.5 |
| September | 362.88 | 10886.3 |
| October | 243.75 | 7556.2 |
| November | 131.64 | 3949.14 |
| December | 104.55 | 3240.94 |
| Total yearly | 117118 |
Solar power output calculated at 25o
| Month | Average Daily kWh/d | Average Monthly kWh/mo |
|---|---|---|
| January | 124.07 | 3846.21 |
| February | 198.88 | 5568.51 |
| March | 289.65 | 8979.05 |
| April | 442.96 | 13288.7 |
| May | 515.85 | 15991.5 |
| June | 476.6 | 14298 |
| July | 532.78 | 16516.1 |
| August | 466.89 | 14473.6 |
| September | 375.51 | 11265.3 |
| October | 259.75 | 8052.38 |
| November | 144.86 | 4345.81 |
| December | 118.7 | 3679.62 |
| Total yearly | 120305 |
Aberdeen Solar generation calculated at 30o
| Month | Average Daily kWh/d | Average Monthly kWh/mo |
|---|---|---|
| January | 135.91 | 4213.18 |
| February | 212.5 | 5950.12 |
| March | 300.29 | 9309.1 |
| April | 448.23 | 13447 |
| May | 513.33 | 15913.2 |
| June | 470.5 | 14114.9 |
| July | 528.12 | 16371.8 |
| August | 469.25 | 14546.8 |
| September | 385.75 | 11572.4 |
| October | 273.84 | 8489.04 |
| November | 156.8 | 4704.1 |
| December | 131.6 | 4079.65 |
| Total yearly | 122711 |
Solar power calculation notes:
We made a few assumptions when making the above solar power output calculations.
Losses: The numbers in the reports take into account 10% technological losses based on the electrical parts of a solar installation. There are also -2.72% angle of incidence loss and -2.77% temperature and irradiance loss. This totals to about -14.88%%.
Location: We do not know your exact location so we can not take into account your surroundings, the elevation and terrain specifics. The solar power output calculations are based on panels being optimally facing the sun in the optimal case or uniformly faced South in the other cases.
Errors: Please keep in mind that although we did our best, the information presented here might contain errors. As such, please contact a local solar installer for individual report based on your exact location.
Solar panel degradation: Solar panels loose efficiency over time. The reports are valid for the initial panel installation. Most solar panel manufacturers guarantee 80% generation after 25 years.